The national apartment market moved closer to balance during Q2 2026 as renter demand improved and new construction began to slow. Rent growth remained modest, and recently delivered communities continued to compete for residents in markets with heavy construction. Economic growth and employment remained supportive of apartment demand, although slower job creation, above-target inflation, and elevated borrowing costs kept the outlook measured. Across Cincinnati, Columbus, Indianapolis, and Lexington, long-term demand drivers remained intact, but near-term results varied according to the amount and location of new supply.
US Economy
The U.S. economy grew at a 1.5% annual pace in Q2 2026, compared with 2.1% in Q1. Consumer spending remained healthy, which supports residents’ ability to meet monthly obligations. At the same time, slower overall growth and a more moderate pace of job creation may limit household formation, as some renters delay moving out on their own or forming new households. For apartments, this points to steady demand, but not an environment in which owners should assume strong near-term rent increases.
The job market continued to grow, but at a slower pace. Employers added 57,000 jobs in June, unemployment was 4.2%, and wages were 3.5% higher than a year earlier. The Federal Reserve’s preferred inflation measure was 3.3% in June, still above its 2% goal. The Fed therefore held its short-term interest-rate target at 3.50% to 3.75% and indicated that meaningful rate relief may take time. For apartment investors, employment and wage growth remain supportive, while borrowing costs continue to make new construction and acquisitions more difficult.
The following chart shows the durability of apartment demand as financing conditions stay restrictive.
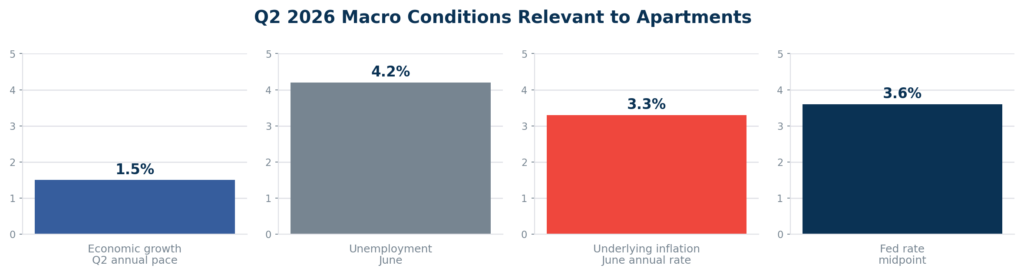
Source: Bureau of Economic Analysis, Bureau of Labor Statistics, and Federal Reserve. Economic growth is shown at an annual pace; unemployment and underlying inflation are June readings; the Fed rate is the quarter-end target midpoint.
National Apartment Market
Supply and construction pipeline
The construction wave is beginning to recede. CoStar recorded approximately 113,000 net apartment deliveries in Q2, 25% fewer than in Q2 2025, with the number of units under construction having fallen meaningfully from its recent peak. New supply will remain a competitive factor in the near term, but fewer construction starts should reduce pressure as the current pipeline is completed.
Renter demand and net absorption
Renter demand strengthened in Q2. CoStar measured approximately 152,000 units of quarterly net absorption, meaning that the number of occupied apartments increased by about 152,000 during the quarter. Demand exceeded new deliveries, an encouraging sign that the market is beginning to work through the recent wave of construction.
Rent and occupancy fundamentals
Overall vacancy was 8.0% at quarter-end, down from 8.3% one year earlier. This figure includes newly built properties still in initial lease-up, where vacancy is naturally higher. Stabilized vacancy, which excludes properties in lease-up and provides a clearer measure of conditions at established communities, was 7.0%. The distinction is important because stabilized vacancy better reflects the operating environment faced by mature apartment properties, while overall vacancy also captures the temporary effects of recently delivered supply.
Effective rent growth improved but remained modest at 1.2% year over year, according to CoStar. Concessions, such as free rent or other move-in incentives, remain most common in recently delivered properties and markets with substantial new supply. Resident retention has become increasingly important in this environment. RealPage data cited by CBRE show that renewals represented 57% of leasing activity, reinforcing the value of responsive service, timely follow-up, and a consistent renewal process.
Capital Markets
Apartment sales activity increased from the first quarter, although one unusually large company-level transaction accounted for much of the improvement. CBRE reported $34.9 billion of Q2 2026 multifamily sales, up 18% from Q1 but down 2.7% from Q2 2025. The total included the $3.4 billion sale of Veris Residential. Excluding that transaction, volume was approximately $31.5 billion and about 8% below the prior year. This cleaner comparison suggests that buyers remain active, but selective.
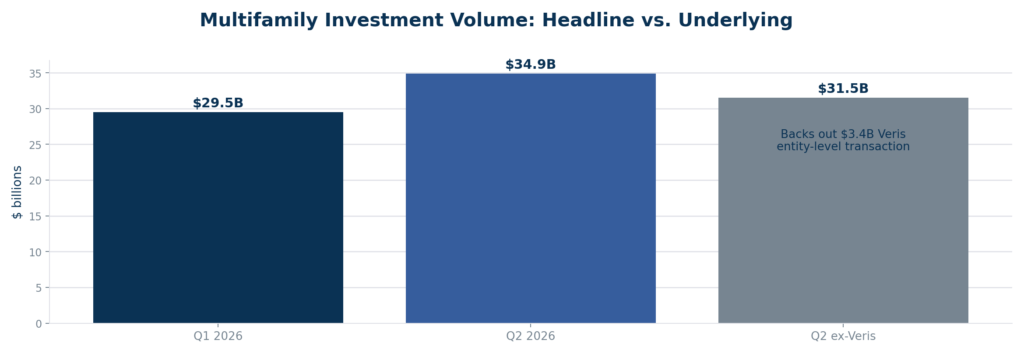
Source: CBRE Q1 and Q2 2026 U.S. Multifamily Figures. Q2 ex-Veris subtracts the disclosed $3.4B entity-level transaction.
Cap rates, which compare a property’s income with its purchase price, were generally stable to slightly higher in Q2. CoStar’s broad national estimate was near 6.2%, while many higher-quality apartment transactions occurred between 5.0% and 5.5%. Local transactions showed a wider range because property age, location, occupancy, and capital needs differed substantially.
Across commercial real estate, CBRE reported $124.5 billion of Q2 investment sales, up 15% from a year earlier. Apartments represented roughly 28% of the total and remained one of the largest and most actively traded property types. Investors continue to value the broad need for rental housing and the improving supply outlook, but individual investments still require careful attention to debt, property condition, local competition, and realistic cash flow.
Financing conditions improved modestly, but borrowing costs remained elevated. CBRE reported that average multifamily loan pricing improved from a year earlier, while lenders generally required borrowers to contribute more equity. This environment continued to limit highly leveraged purchases and new construction, while favoring transactions supported by durable current income and conservative debt assumptions.
Target Markets: Cincinnati, Columbus, Indianapolis, and Lexington
Ackermann Group’s target markets share several durable characteristics, including comparatively attainable rents, diversified employment bases, and lower housing costs than many coastal and high-growth Sun Belt markets. Their Q2 apartment results were not uniform. Cincinnati reported the lowest vacancy among the four, Lexington recorded the strongest rent growth, and Columbus and Indianapolis continued to absorb sizable construction pipelines. The following figures are market-level conditions, not projections for any individual property.
Market | Overall vacancy | Trailing 12-month rent growth | Under construction (% of inventory) |
United States | 8.0% | 1.2% | 556,516 (2.7%) |
Indianapolis | 10.4% | 1.0% | 4,399 (2.5%) |
Columbus | 10.1% | 1.2% | 8,604 (3.7%) |
Cincinnati | 8.5% | 1.8% | 4,133 (2.7%) |
Lexington | 8.9% | 3.0% | 905 (2.2%) |
Source: CoStar market reports dated Aug. 5, 2026. Vacancy and units under construction are quarter-end figures; rent growth is for the trailing 12 months. Percent-of-inventory figures are reported by CoStar.
The following chart compares Q2 overall vacancy with trailing 12-month asking-rent growth, illustrating how recent construction has affected each market differently.
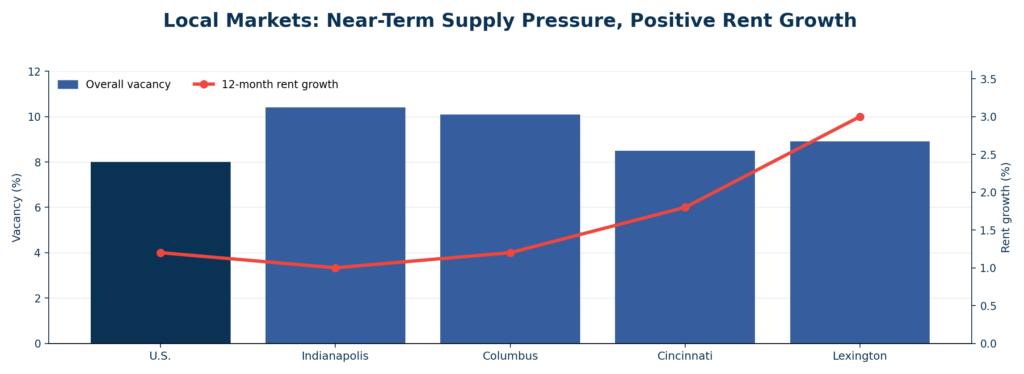
Source: CoStar U.S., Indianapolis, Columbus, Cincinnati, and Lexington multifamily reports dated Aug. 5, 2026. Vacancy is the Q2 quarter-end reading; rent growth covers the trailing 12 months.
Market observations
Indianapolis
- Economy: Logistics, healthcare, manufacturing, education, and government provide a broad employment base.
- Apartment fundamentals: Overall vacancy was 10.4%, 12-month rent growth was 1.0%, and 4,399 units, or 2.5% of inventory, were under construction. Demand remained positive, and the pipeline was the smallest since 2020.
- Capital markets: Trailing 12-month sales totaled approximately $713 million. Activity was near pre-boom norms, with cap rates roughly 100 basis points above the cyclical low.
Columbus
- Economy: Government, Ohio State University, healthcare, insurance, logistics, and technology provide a diverse demand base.
- Apartment fundamentals: Overall vacancy was 10.1%, 12-month rent growth was 1.2%, and 8,604 units, or 3.7% of inventory, were under construction. Deliveries continued to outpace strong demand.
- Capital markets: Trailing 12-month sales totaled approximately $324 million. Private and value-add buyers were most active, while a few large transactions had an outsized effect on volume.
Cincinnati and Northern Kentucky
- Economy: Healthcare, education, consumer products, finance, manufacturing, and logistics anchor the region.
- Apartment fundamentals: Overall vacancy was 8.5%, 12-month rent growth was 1.8%, and 4,133 units, or 2.7% of inventory, were under construction. Deliveries exceeded absorption, although Northern Kentucky was generally stronger than the urban core.
- Capital markets: Trailing 12-month sales totaled approximately $409 million. First-half activity was muted, with pricing differentiated by quality, vacancy, and capital needs.
Lexington
- Economy: The University of Kentucky, healthcare, manufacturing, logistics, agriculture, and technology provide a varied employment base.
- Apartment fundamentals: Overall vacancy was 8.9%, 12-month rent growth was 3.0%, and 905 units, or 2.2% of inventory, were under construction. Rent growth led the four markets, but because Lexington has a smaller inventory and transaction base, a limited number of properties can have a greater effect on reported market averages.
- Capital markets: Trailing 12-month sales totaled approximately $173 million. The market cap rate was about 6.3%, while closed trades averaged about 6.7%.
Conclusion
The current market environment continues to show encouraging signs of improving balance and continued support for long-term multifamily investment outlook.
National renter demand exceeded new supply, with approximately 152,000 units absorbed during the quarter compared with 113,000 net deliveries, while deliveries declined 25% from Q2 2025 and the construction pipeline continued to contract. These trends should gradually reduce competitive pressure as recently completed properties are absorbed. Multifamily also remained one of the most active commercial real estate sectors, representing approximately 28% of Q2 investment sales, with transaction volume increasing 18% from the first quarter.
For Ackermann Group’s existing investments, improving supply and demand fundamentals provide a more supportive backdrop, although elevated vacancy, concessions, and modest rent growth continue to require careful pricing, resident retention, and property-level execution. For prospective investments, durable demand for rental housing, slowing construction, and improving transaction liquidity support continued investment in multifamily, while current financing costs and varied local conditions reinforce the importance of conservative underwriting, disciplined asset selection, and acquisition pricing that appropriately reflects property-specific risks.