A LOCAL OPERATOR’S VIEW
There is a comfortable way to talk about multifamily right now: wait for rate cuts, wait for concessions to burn off, wait for rent growth to look normal again. It sounds prudent. In a long-duration business, it is often the expensive choice.
A multifamily project typically takes 18 to 30 months to move from groundbreaking to certificate of occupancy. Add lease-up and the lag grows longer. The buildings pressuring rents in 2026 were conceived under 2021–2023 assumptions—cheaper capital, stronger exit pricing and a willingness to finance growth before cash flow. Today’s operating statements are therefore a rear-view mirror. Today’s starts, purchases and capital plans are the windshield.
The last wave is still landing, so the operating environment should feel difficult. Concessions remain visible. Expense growth is real. Debt proceeds are tighter. But a soft coincident indicator is not a bearish leading indicator. By the time recovery becomes obvious in trailing rent growth, the most attractive basis, the least crowded acquisition window and the best construction timing will already have been claimed.
The pipeline has already reset
Start with what builders have done, because it is the least ambiguous part of the picture. RealPage counted roughly 340,200 apartment units delivered nationally in the year ending Q2 2026—the sixth consecutive quarterly decline in annual supply and 42% below the late-2024 peak near 588,000. For the first time in three years, annual deliveries fell below the decade norm. [1]
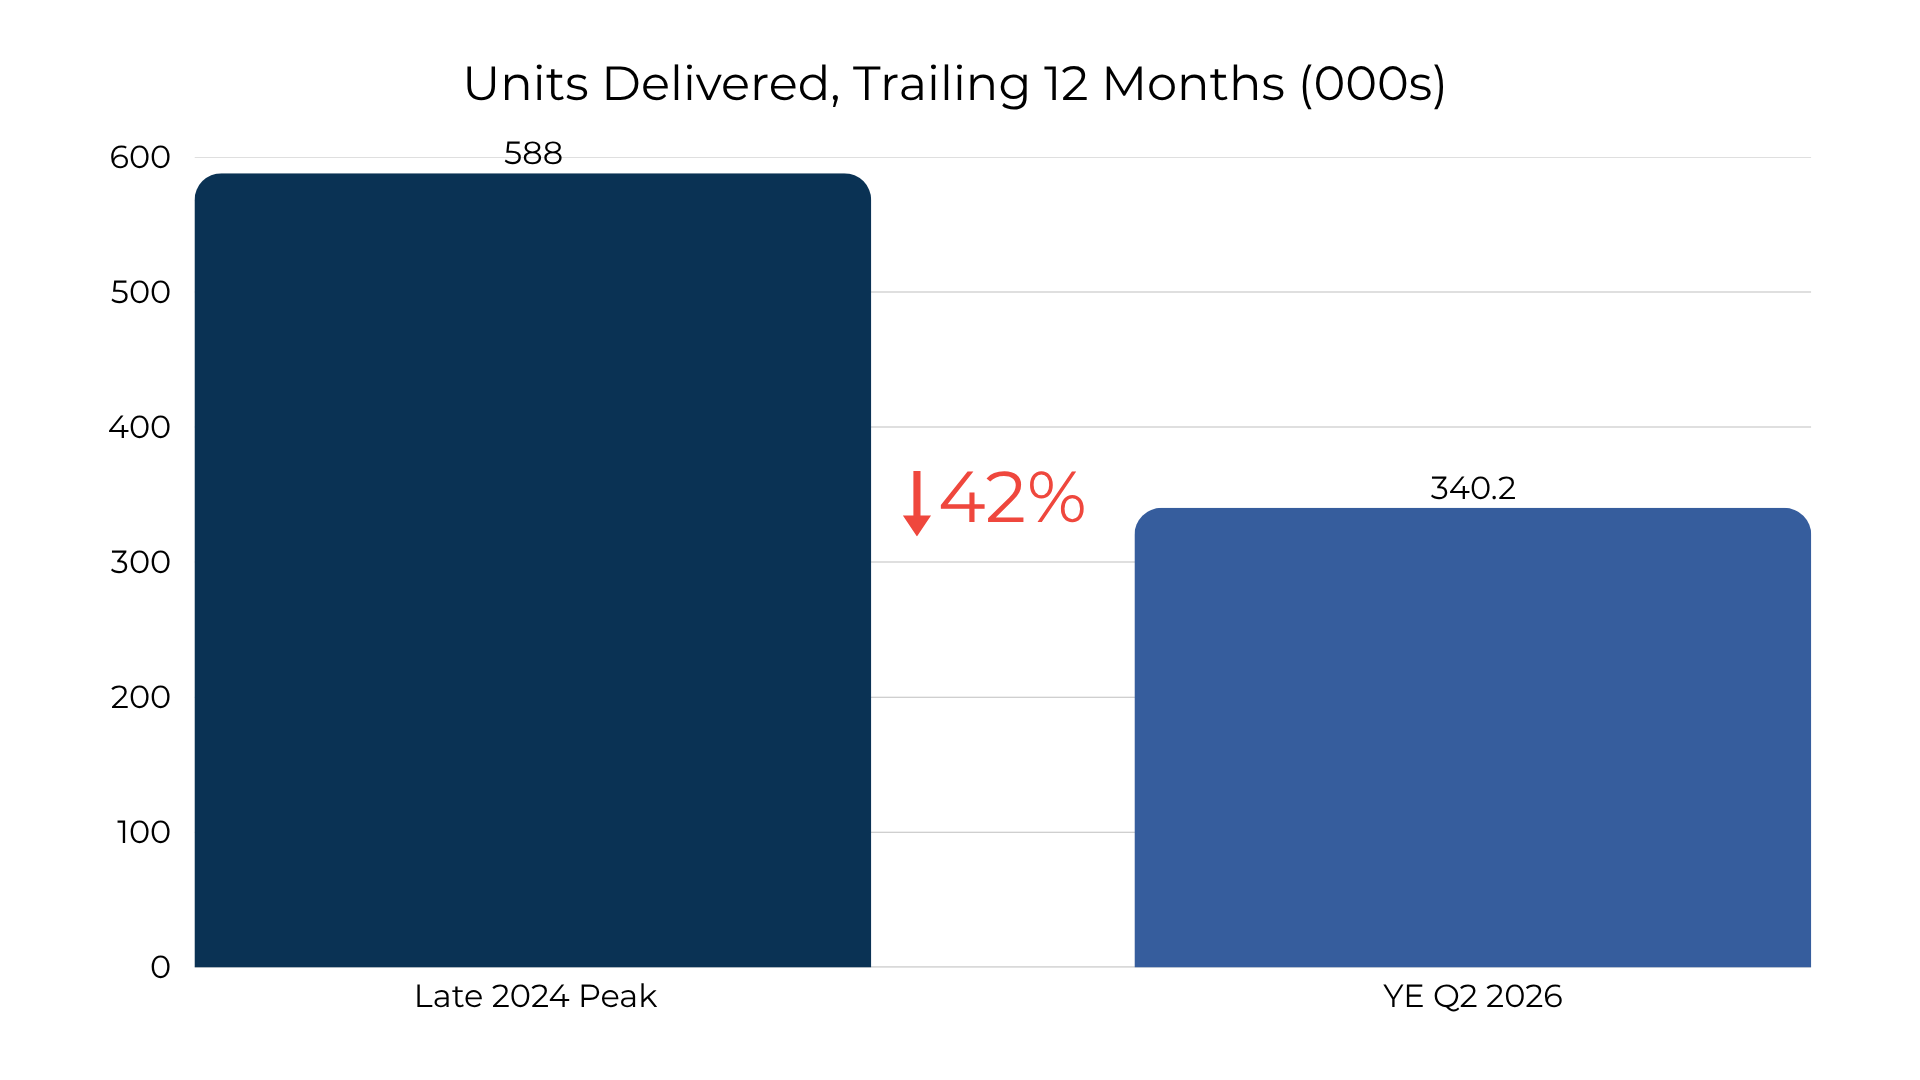
FIGURE 1 | The supply wave is receding before the headlines have recovered. Source: RealPage, July 2026.
The Census Bureau tells the same story from a different angle. In July, 666,000 units in buildings with five or more units were under construction, down from 697,000 a year earlier. The latest release also showed multifamily completions at a 329,000-unit annualized pace. [2] One month can be noisy; the direction across permits, starts, construction and deliveries is what matters. The inventory of future competition is thinning.
That does not mean every market is undersupplied today. It means the industry is no longer replenishing the pipeline at the pace required to keep today’s competitive pressure in place. Supply cycles turn slowly, then show up all at once in leasing offices.
The quiet inflection is already here
National occupancy reached 95.5% in Q2, up for a second consecutive quarter. Effective asking rents rose 1.4% during the quarter, even though they remained 0.2% below the prior year. Demand absorbed more than 187,000 units from April through June. [1] Those are not boom numbers. That is precisely the point: inflections arrive first as sequential improvement inside weak annual comparisons.
Single-family rentals provide another read on household demand. Cotality reported only 1.3% annual rent growth in May, but rents rose 2.2% from February through May—better than the same spring stretch in both 2025 and 2024. The national headline remains subdued; underneath it, the Midwest and Northeast remained the strongest regions. [3] There is no single recovery clock. The geography matters.
The small recovery is splitting by region
The national average compresses four different stories into one number. In the Midwest, a generally lighter construction cycle and attainable rents are supporting steadier occupancy and rent performance. The South is still digesting the largest concentration of recent supply. The Northeast is adding apartments into markets that were underbuilt for years, so demand can remain strong even as new completions surge. The West contains both supply-constrained coastal rebounds and Mountain West markets still working through excess inventory.
Midwest — the quiet, income-led recovery. Midwest completions were down only 1.6% year over year in Q1, while units under construction declined 5.4%. [4] That is less dramatic than the pullback elsewhere, but the operating signal is better: RealPage reported that every region except the South had occupancy around 96% or higher in Q2, and July rent data continued to place several Midwest metros among the national leaders. [1][5] The region’s advantage is not explosive growth. It is a more balanced supply history, achievable resident affordability and less dependence on a migration boom.
South —The South remained the only region with annual apartment rent declines and occupancy below 95% in Q2. [1] Q1 completions fell 26% year over year, evidence that the correction is under way, but starts rose from 164,000 to 230,000. [4] That combination explains why headline “pipeline decline” arguments can mislead: the South is improving, but a large installed pipeline and renewed starts can extend concessions and delay pricing power. Selectivity matters more than simply being early.
Northeast — strong demand meeting a fresh wave. Northeast completions jumped 42.1% and starts rose 81% in Q1, the only region with higher completions. [4] Yet the region began from chronic undersupply, and high home prices continue to support renting. The result is dispersion inside the region: Boston and Philadelphia asking rents softened in April while New York remained positive. The Northeast recovery is not a clean scarcity story; it is a test of how much new supply entrenched demand can absorb.
West — the fastest pipeline retreat, but two very different markets. Units under construction fell 14.7% and completions dropped 37.9%, the sharpest regional pullback. [4] That creates a powerful setup where demand is intact. But the West is bifurcated: July rents rose 5.3% in San Francisco while Denver declined 2.7%, with Phoenix also negative. [5] Coastal technology markets and high-supply Mountain West markets should not share one underwriting assumption.
What a local operator sees that a screen does not
A national data set can identify the turn. It cannot tell you which side of I-465, I-270 or I-275 residents will choose, which school district retains families, whether a concession is embedded or advertised, or whether a competitor’s “renovated” unit is actually comparable. In Ohio, Indiana and Kentucky multifamily, those details are the investment thesis. This is where proximity creates alpha.
Supply is one of the clearest examples. National data platforms such as RealPage and CoStar are essential to market analysis, but a scheduled delivery date is still an estimate. In markets where AG operates, properties may appear in a current-year delivery schedule even though a physical site visit shows dirt, limited infrastructure work or construction progress that makes completion this year improbable.
The same principle applies across the model. A headline employer expansion may be too far from the asset to change demand. A low tax expense may simply be waiting for reassessment. A broker may know that the marketed deal is not the deal the seller will actually execute. Data narrows the field; physical presence and accumulated context determine whether the signal is investable.
There is no perfect time, only a properly structured time
“Now” does not mean buy anything. It means the conditions for disciplined, long-hold investing are more favorable than the mood suggests. CBRE estimates buying a home carries a 105% monthly premium to renting, while renewal leases now account for 57% of leasing activity.
The momentum trade built on cheap leverage and cap-rate compression is not the same thing as apartment investing. Across the long record, income, not appreciation, did most of the compounding. [7] The right response is not to wait for the old trade to return. It is to buy and operate for the business that remained after it left.
The cost of waiting is not zero
Investors on the sidelines are preserving optionality. They are also accepting reinvestment risk. If occupancy firms, lenders gain confidence and transaction volume returns, bid depth can improve before rent growth looks impressive. If starts remain constrained, construction sites become harder and more expensive to secure just as the 2028–2029 supply window opens. Waiting for certainty often means paying the certainty premium.
The regional split makes that trade-off unusually clear. The Midwest can offer steadier income before the national recovery is obvious, but even neighboring metros are at different points in the cycle. Columbus offers a forward supply reset behind a difficult lease-up year. Indianapolis is moving past peak deliveries with corridor-level dispersion. Cincinnati is already showing pricing power despite localized new supply. Lexington remains comparatively balanced, with its active pipeline as the central underwriting question. In each market, returns should come from rent checks, resident retention and better operations—not from guessing the next Federal Reserve meeting.
There will be no bell at the bottom. The signal is already here: global capital is re-engaging, U.S. deliveries are falling, occupancy is stabilizing and AG’s Midwest markets are moving from supply absorption toward recovery on different timelines. The last supply wave is still visible. The next one is not. That gap—and the local knowledge to identify where it matters first—is the opportunity.
Sources and notes
1. U.S. Apartment Market Gains Momentum as Occupancy and Demand Improve. RealPage, July 6, 2026. View source
2. Monthly New Residential Construction, July 2026. U.S. Census Bureau and HUD, August 18, 2026. View source
3. Annual Single-Family Rent Growth Remains Below Trend While Spring Leasing Season Drives Stronger Gains. Cotality, July 16, 2026. View source
4. How a Northeast Apartment Boom Could Soon Make Rent Cheaper. Realtor.com, May 13, 2026. View source
5. Multifamily Rents Extend Recovery in July Despite Supply Pressures. Multifamily Executive, citing Yardi Matrix, August 7, 2026. View source
6. U.S. Real Estate Market Outlook 2026: Multifamily. CBRE, October 2025. View source
7. The Apartment Trade Is Over. Back to Apartment Investing.. Sam Lawhead; user-provided article, May 13, 2026.
8. Global Real Estate Outlook 2026: Six Forces Reshaping Commercial Real Estate. JLL, December 2025. View source
9. Columbus Multifamily Market Report, Q1 2026. Colliers, May 19, 2026. View source
10. Indianapolis Multifamily Market Report, Q2 2026. Institutional Property Advisors, 2026. View source
11. Cincinnati Multifamily Market Report, Q2 2026. Institutional Property Advisors, 2026. View source
12. Lexington Multifamily, Q2 2026. Commercial Kentucky / Cushman & Wakefield Alliance, August 2026. View source